Are you looking for the best server hardware monitoring software? Do you need to monitor CPU usage, memory utilization, system temperature, disk space, and more?
Then you’re in the right place.
In this guide, I list the best FREE and premium server hardware monitoring tools.
- SolarWinds System Management Bundle
- PRTG Monitor
- Nagios XI
- HWMonitor
- SysGauge
- Zabbix
- ManageEngine OpManager
- The Top 10 features for effective hardware monitoring
Why is server hardware monitoring important?
Hardware monitoring software is designed to monitor the health and performance of your hardware assets. Failed hardware can lead to poor server performance or even worse system outages, this can cause downtime for critical business systems. At a glance hardware monitoring can help with the following:
- Identify server hardware health issues such as high temperature, bad disks or high CPU usage
- Provide alerting and notification of server and hardware issues
- Capacity planning and forecasting
- Minimize server and application downtime
List of the best 7 Server and Hardware Monitoring Tools.
1. SolarWinds System Management Bundle
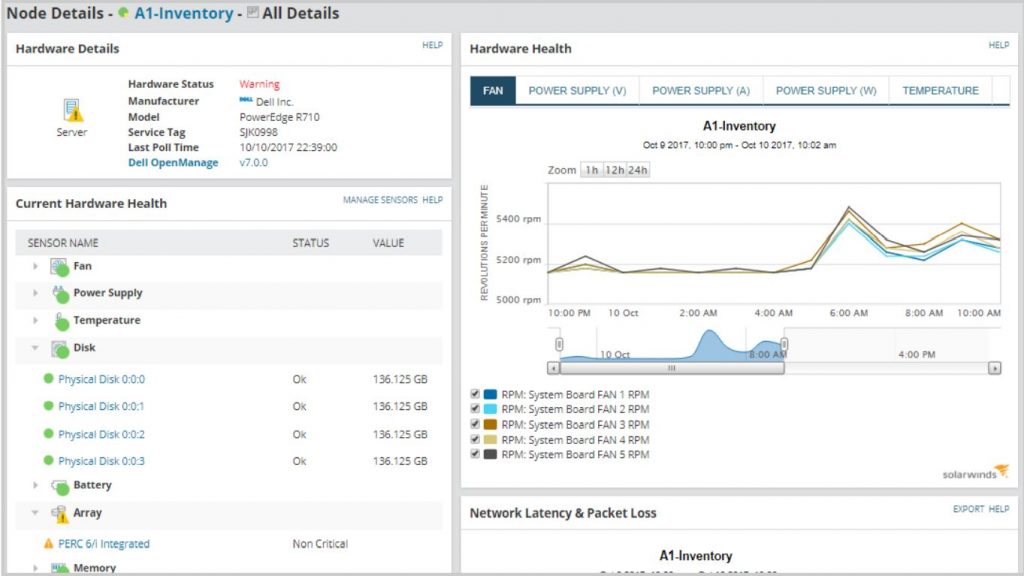
The System Management Bundle is a collection of four tools that give you complete visibility into server hardware and applications. These tools provide comprehensive monitors for the health and status of multi-vendor server hardware and hundreds of applications including SQL server, VMWare, Active Directory, Office 365, and more.
The management bundle includes the following tools:
- Server and Application Monitor
- Virtualization Manager
- Storage Resource Monitor
- Web performance Monitor
The System Management Bundle is a powerhouse set of tools that will help you monitor and manage critical server hardware and software assets. In addition, it gives you a single pane of glass to monitor server hardware and application performance.
2. PRTG
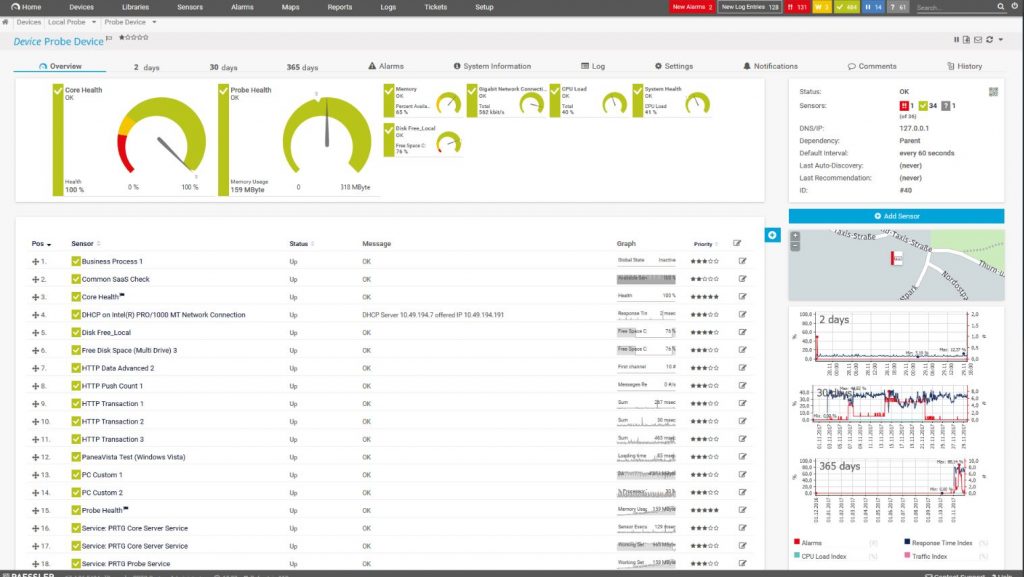
PRTG is best known for its network monitoring tools but it can also be used to monitor servers and hardware. You can monitor CPU, RAM, hardware drives, printers, and more. It has built in sensors for vendors like HP, Dell, Cisco, and IBM.
All hardware data can be viewed from a centralized web based dashboard. Most administrators don’t have time to stare at a dashboard to monitor their servers and hardware. PRTG has an alert system that can send you a notification via email or text message on certain events. For example, when the CPU temperature reaches a certain threshold it can send an email notification.
The installation process is easy and only runs on Windows servers. Once installed you can have it auto discover devices to monitor by providing it a range of IPs to scan.
PRTG starts are $1750 for 500 sensors.
Website
https://www.paessler.com/server_monitoring_software
3. Nagios XI
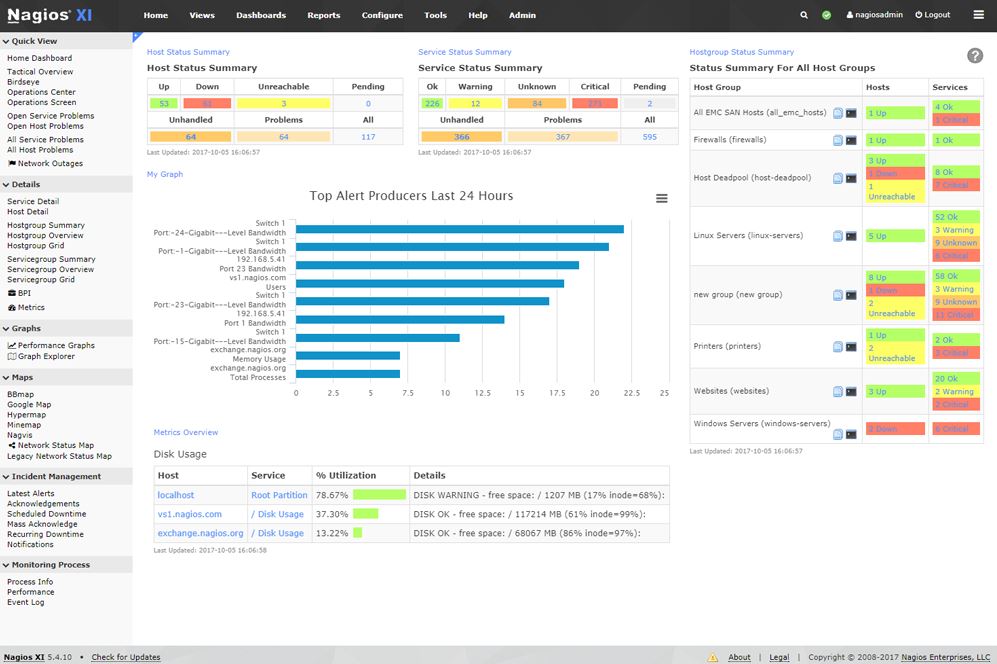
Nagios XI is a complete server and hardware monitoring solution. It can monitor Windows servers, Linux, Unix, Solaris, MAC, and more.
Nagios is a flexible solution allowing the monitoring of servers with or without an agent. In addition to its out of the box monitoring, it also has 3500 different addons available for monitoring your servers.
Key Features
- Complete IT infrastructure monitoring
- Customizable Web Interface
- Server monitoring
- Easy to use
- Capacity planning
- Alerts
Nagios comes in a standard edition starting at $1,995 and an enterprise edition starting at $3,495. Licensing is based on the number of nodes you have, each device with an IP address is considered a node and requires a license.
Website
https://www.nagios.org/
4. hwmonitor
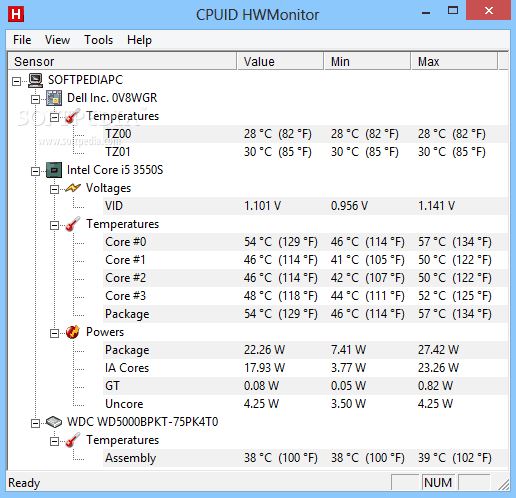
HWMonitor is a great tool for monitoring computer hardware. The tool shows all of the monitored hardware on a single window. This tool can handle the most common sensor chips, can read modern CPUs on-die core thermal sensors, and also read hard drive temperatures, and GPU temperature.
HWMonitor is a free tool. There is also a pro version that allows for remote monitoring, saving of data, and an improved interface.
Website
https://www.cpuid.com/softwares/hwmonitor.html
5. SysGuage
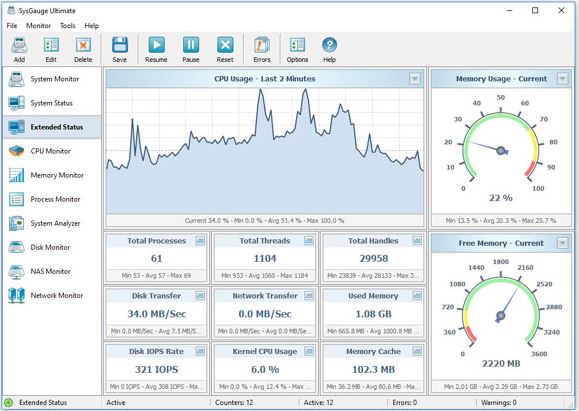
SysGauge is an easy to use hardware monitor for local or remote computers. This tool can monitor CPU usage, memory, disk space, disk activity, disk transfer rates, IOPS, for individual disks or all physical disk on a computer.
The SysGauge GUI provides a single customizable interface for monitoring a single task at a time. It does not have an advanced dynamic dashboard like other products such as SolarWinds that allows you to view multiple system resources across multiple systems. It does give you a quick view of resources one at a time. For example, if you want to see CPU usage you will need to click on the CPU usage on the left hand side.
This is a nice tool if you have a few systems you need to monitor. I do not consider this an enterprise level tool.
SysGuage comes in a free version for up to 10 monitors, the Pro version ($50) allows for 50 monitors, the ultimate version ($125) 100 monitors, and the server version ($125) allows 200 monitors.
Website
https://www.sysgauge.com/
6. Zabbix
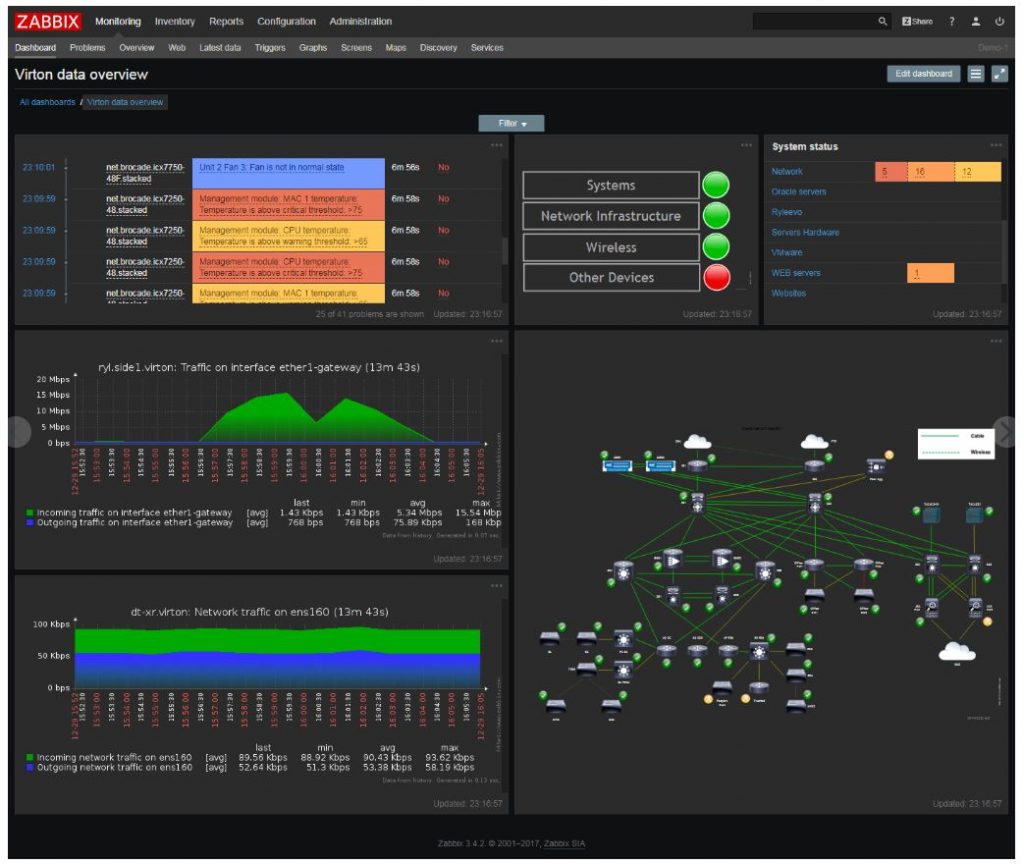
Zabbix is an IT infrastructure monitoring tool that can monitor server performance and track changes to the hardware. Zabbix is a free and open-source, it’s meant for big networks that don’t want to spend a fortune to monitor their systems.
Key Features
- Templates for monitoring various server hardware
- Auto discover assets
- Server uptime reporting
- Alerting
- Configuration change auditing
Zabbix is available for Red hard, CentOS, Oracle Linux, Ubuntu, Debian, SUSE, and Raspbian. Unfortunately, no Windows install.
Website
https://www.zabbix.com/
7. ManageEngine OpManager
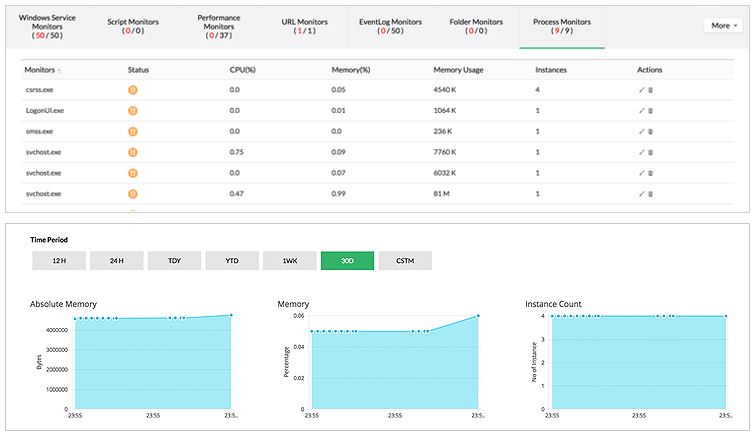
ManageEngine OpManager provides multi-vendor monitoring of server hardware and applications. Servers can be monitored by SNMP or WMI protocols to ensure system resources are performing as expected. OpManager will monitor server CPU, memory, processes, services, event logs, scripts, URLs, and more.
Key Features
- Real-time server performance monitoring
- Server availability and health monitoring
- Proactive server monitoring with multi level thresholds
- Monitor application performance
- Monitor VMware ESX servers and Guest OS performance
- Windows services monitoring
- Server process monitoring
Website
https://www.manageengine.com/network-monitoring/
The 10 Most Important Features for Effective Hardware Monitoring
Here is my list of the top 10 features a server hardware monitoring tool should have. In a business environment, you need a monitoring tool that will help quickly identify the root cause of an issue. To find the root cause you need to monitor all server resources to track performance, capacity planning, and to potential hardware issues.
A premium server monitoring tool should include all of these features. To find the best solution that fits your needs I recommend you download a trial of multiple products to see what works best for you.
1. CPU Utilization Monitoring
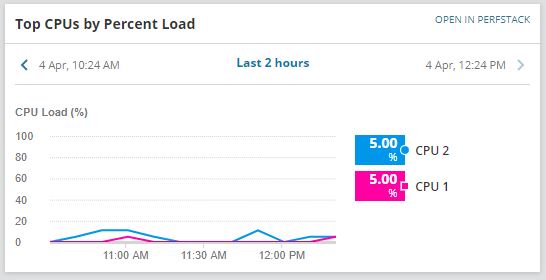
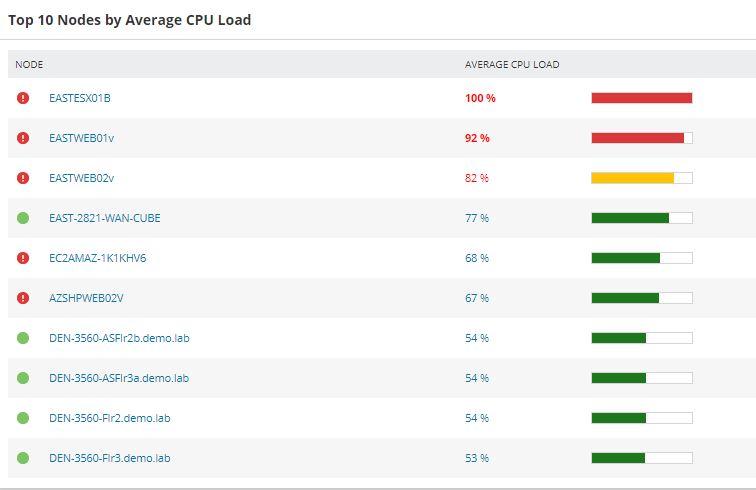
When monitoring a server or any critical device you must monitor the CPU usage. Most performance issues are related to high CPU utilization or a lack of CPU resources. I like to see on my dashboard the top 10 systems by CPU usage. This is a quick way to see current CPU usage and spot any potential issues. Then I can click on one of the systems to get more details.
2. Memory Utilization
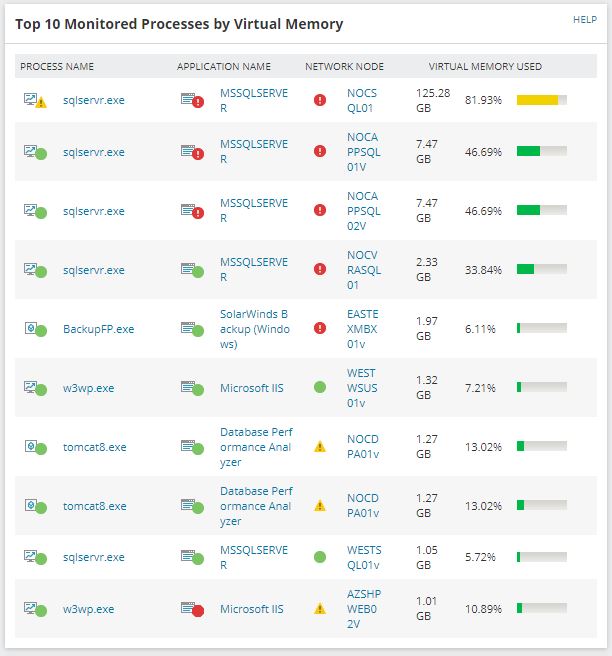
The next biggest performance killer is memory utilization. If your servers and applications don’t have enough memory they will have poor performance. Some products like SolarWinds SAM let you monitor memory by processes. This lets you easily identify exactly what is consuming all the memory on your servers.
Another reason I like to monitor the memory 24/7 on all systems is so I can effectively manage my resources. Sometimes vendors or other admins will say they need some ridiculous amount of memory on their server. I always recommend starting at a minimum amount of RAM and then adding more if it is needed. Sometimes vendors will ask for 64GB of ram, so I’ll start them at 8 or 16 then monitor it. Most of the time I never need to add the amount of memory that is requested. If it is ever a question I can show them the monitoring reports to prove the server or application does not need the crazy amount of resources that they are requesting.

The above picture is a server’s memory usage for the last 12 hours. I’m using SolarWind SAM to monitor all my servers. I can quickly pull up the memory usage on any node being monitored. If someone asks about poor performance or requests more memory I can look at the graphs and easily see if it needs more memory or not.
3. Storage and Disk Monitoring
If your server runs out of disk space then the server and applications will stop running. If your VMWare datastores run out of space all the VMs on that datastore may crash. Not good.
Slow running applications can be due to slow storage systems.
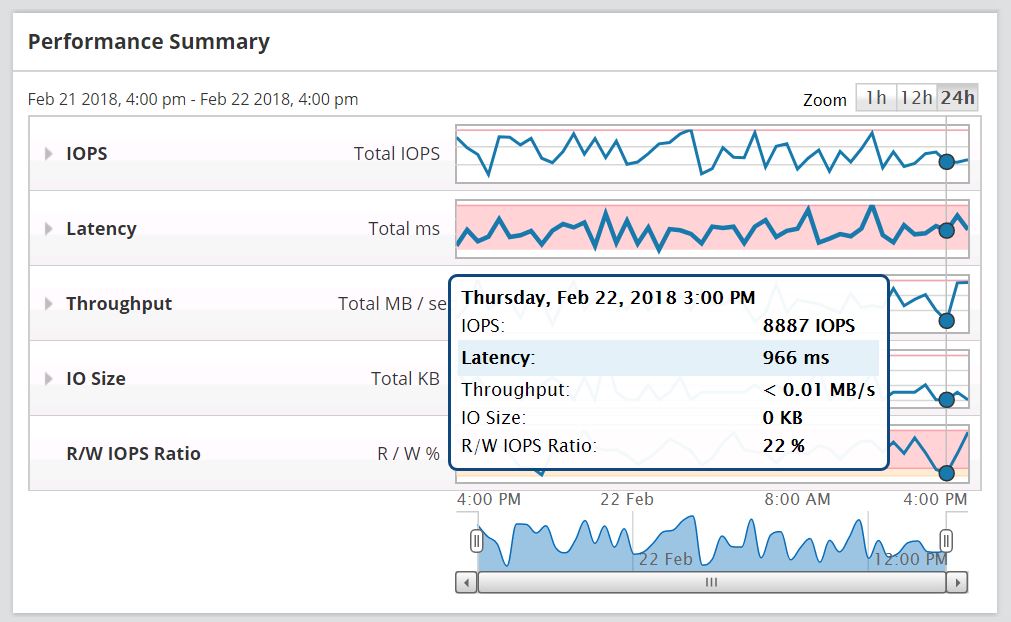
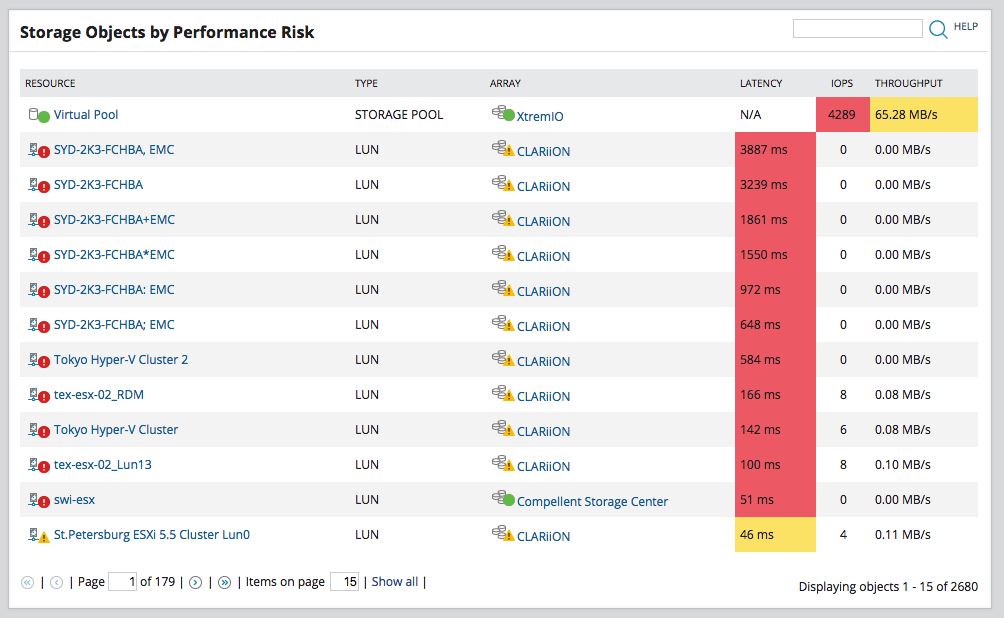
SolarWind storage resource monitor is one of the best storage monitoring tools I’ve seen. It can monitor SAN systems like HP, Nimble, Pure Storage, Dell, EMC, and so on.
4. Monitor Bandwidth utilization
Knowing how much traffic is flowing in and out of your servers is another must have feature. When monitoring servers I always monitor the network interface cards on them so I can track how much data is being sent and received.
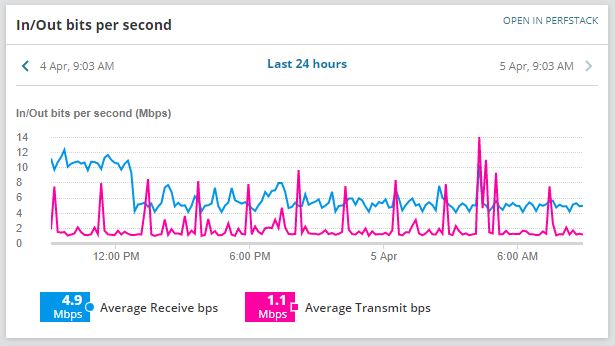
If someone reports a service or application being slow I can check the server’s network interface to see how much traffic is going through the server. This makes it easy to determine if it’s a server issue or a network issue.
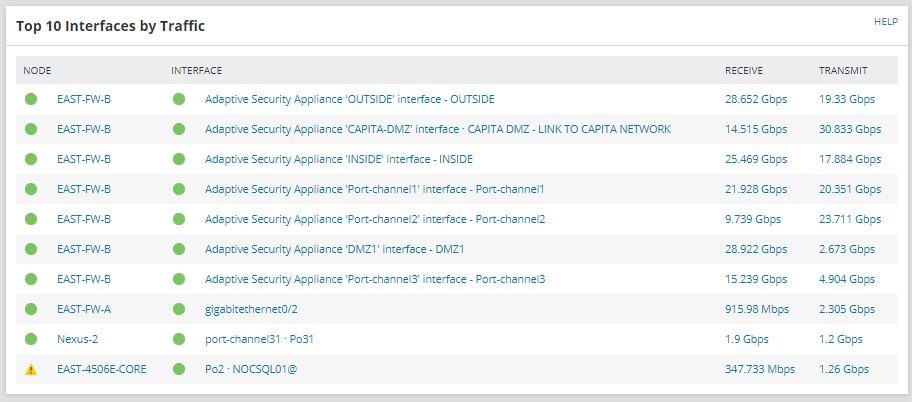
On my dashboard, I like to have a list of the top 10 interfaces by network traffic. This gives a quick overview of the top nodes by traffic on the network.
5. Historical Performance Logs
The server monitoring tool you pick should have the ability to record performance metrics for up to 30 days. This will come in useful when someone says “hey our applications were running really slow the other day”. or “between 7:00 PM and 8:00 PM it takes a really long time for our data to process”
By having historical performance logs you can go back to specific dates or time frames and see the performance of your servers.
For example, here is the CPU load on a server for the last 30 days.

Here are the last 7 days of the CPU and Memory load on a server

You can see over the last 24 hours this server’s CPU usage is very high but memory usage seems fine.
6. Alerts and Notifications
You can’t just sit and stare at a dashboard all day waiting to spot performance or hardware issues.
You need a solution that can alert and send you a notification through email or text messaging. You also need the ability to customize alerts and adjust threshold levels. You may want to get storage alerts when the disk has only 1GB of free space rather than getting alerts when it is 90% full.
Alerts and notifications can also get very noisy and overwhelming so you may want to start with just the critical alerts.
7. Customized dashboard
Most server and hardware monitoring tools come with prebuilt dashboards. The prebuilt dashboards are a great starting point but you want the ability to modify them. Each environment is different and if you have multiple administrators they may need to monitor different servers than you.
I’m a big fan of the top 10 lists. I’ve customized my dashboard to include things like
- Top Nodes by CPU Usage
- Top Volumes by disk space used
- Top Interfaces by Traffic
- Top nodes by packet loss
- and so on
Customizing the dashboard to fit your needs is the fastest way to troubleshoot and be proactive on server and hardware issues. For example, I can quickly see when a server’s hard disk is almost full by monitoring the top volumes by disk. I can be proactive rather than wait for the disk to fill up and users start to report issues.
It’s also a good idea to setup email alerts on things like this.
8. Monitor Services and Processes
So what if resources keep maxing out on a server or multiple servers. How do you know what is causing the CPU or memory usage to spike?
You could log in to each server and watch the running processes but that would be very inefficient plus it doesn’t give provide you with a report or historical data.
With a tool like SolarWinds SAM you can monitor the processes on each server and know exactly what causes high resource usage. SAM also has templates to monitor specific server applications such as:
- Active Directory Monitoring
- Windows Server Monitoring
- Citrix Xenapp
9. Reporting and Inventory
I’ve mentioned reporting several times but it’s worth mentioning again. It’s important for an administrator to be able to provide detailed reports on system hardware and performance. You need to know what hardware you have, make, model, server hardware type, disk size, and so on. If you’re going to monitor all servers and hardware it might as well have a built in inventory function.
Most tools will provide pre-built reports, while other tools give you the ability to create your own reports. I’ve found most of the built in reports to cover most of an administrators needs.
10. Server Uptime and Availability
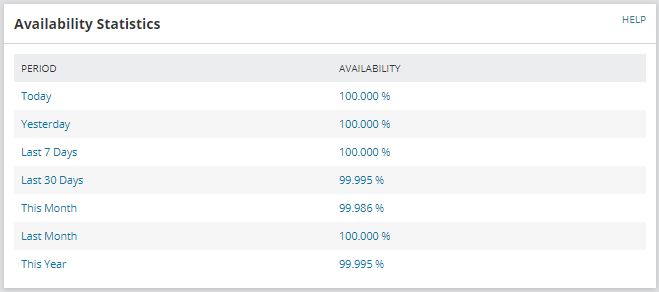
The last feature on my list is the ability to report on server uptime. Monitoring and reporting on server uptime lets you know the availability of your server. Ideally, you want 100% up time or 99.9% uptime.
The monitoring tool you choose should have this feature. In addition, you want the ability to report on availability for the last 24 hours, 7 days, 30 days, and specific time frames. Uptime is a metric that management likes to see, it also helps in reporting issues such as users complaining they couldn’t load their apps at a certain time of the day.
Final Thoughts
If your looking for a server and hardware monitor tool then you can’t go wrong with any on this list. I personally use SolarWinds SAM to monitor server hardware and applications, I also use SolarWinds NPM to monitor my network. Their products are very easy to install and easy to use.
Don’t just take my word for it, I recommend you download multiple products to find what best fits your needs.
