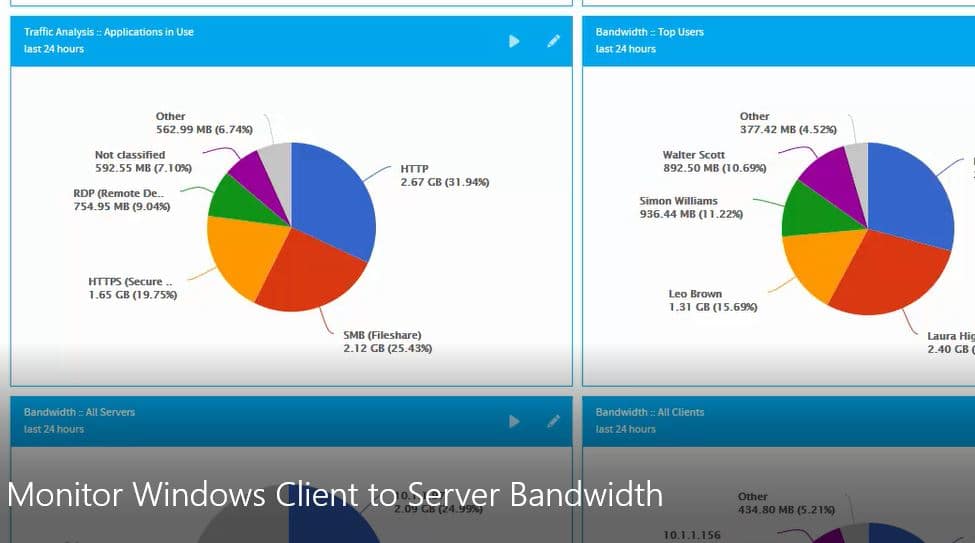
In this guide, I’ll show you how to monitor the bandwidth usage on Windows Servers. In addition, I’ll show you how to use a network traffic analyzer to identify top applications by bandwidth.
Knowing how to check network bandwidth in Windows is important for troubleshooting performance issues and capacity planning.
How to Monitor Windows Server Bandwidth Usage
Step 1: Install and configure the SNMP Service
Before you can monitor the bandwidth usage you need to enable and configure the SNMP service.
Simple Network Management Protocol (SNMP) is a protocol for managing and monitoring devices. It is the most popular protocol for monitoring bandwidth on Windows Servers. The SNMP agent is built into Windows Servers it just needs to be installed through Roles and Features. Follow the steps below to install the SNMP service.
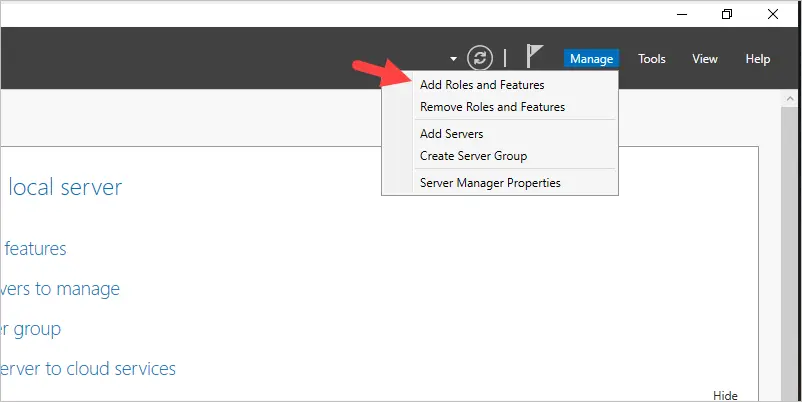
1. Open Server Manager.
2. Click on Manage then Add Roles and Features
3. Click next through the wizard, select the server you want to install it on, click next to features, and select the SNMP Service.
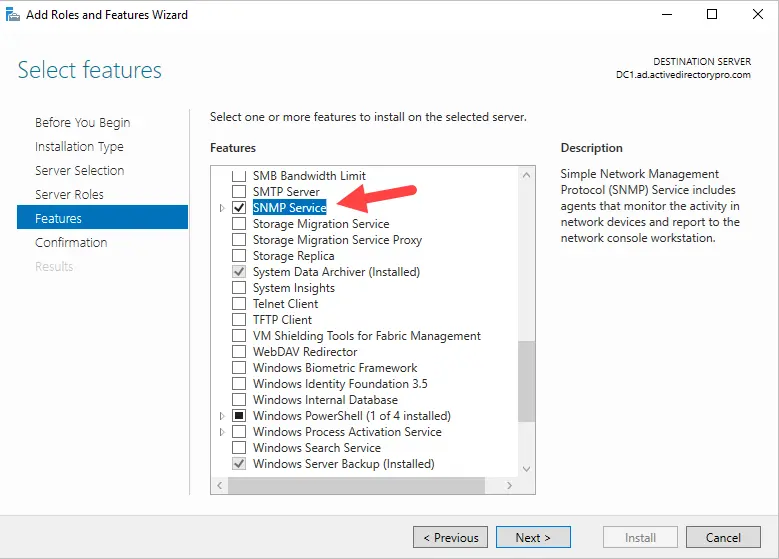
SNMP service should now be installed.
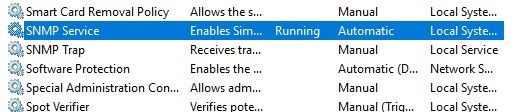
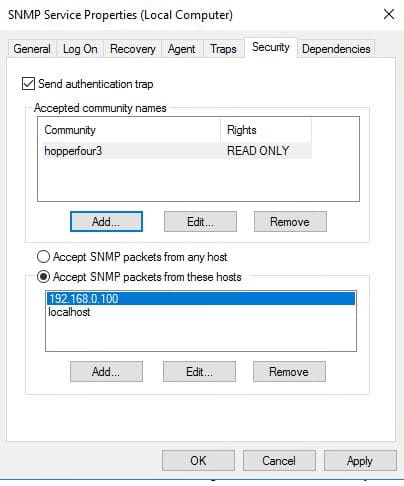
You should always change default settings for security reasons. To change the SNMP settings open up services.msc and open the SNMP Service.
Click on the Security tab, if there is a community string listed delete it.
Now Add a Read Only community string
Next, add the remote server or workstation IP that will be running the bandwidth analyzer. If you are installing the tool locally you can leave it as is.
Below is a screenshot of my SNMP settings. I’m going to be monitoring bandwidth remotely so I entered the IP of my workstation.
This allows the SNMP service agent to access SNMP packets from remote hosts. You only want authorized devices to read SNMP packets.
Now that SNMP is installed and configured we can move on to installing the bandwidth analyzer tool.
Step 2: Install SolarWinds Real-Time Bandwidth Analyzer
The installation is super easy just run the installer and accept the defaults. Now launch the program and let’s walk through the configuration (this is also super easy)
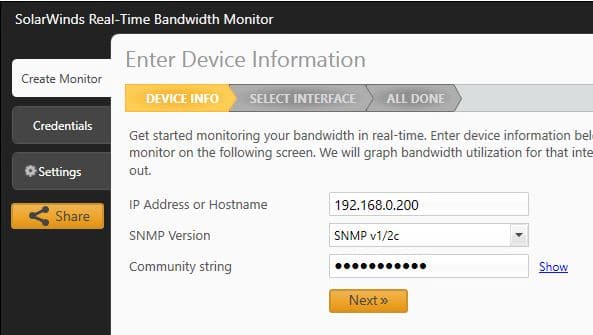
On the device info page enter the server IP or hostname of the server you want to monitor, then enter the SNMP information we setup in Step 1.
Here are my settings:
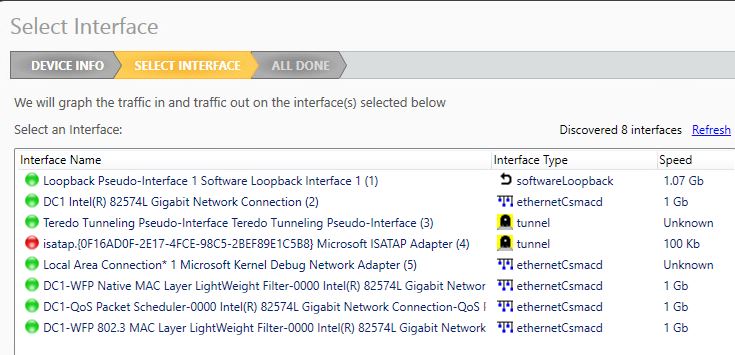
On the select interface page, you should see a list of interfaces on the server.
TIP: You will probably see a bunch of interfaces you didn’t know existed on the server. What I do to make it easy is re-name the network connection on each server to the hostname. For example, I’ve named my network connection DC1, the same as the server hostname. You will see in the screenshot below that I can quickly see which interface I want to monitor because it starts with DC1. This will also help when using other tools.
Select the interface you want to monitor and click next.
On the last screen, you can leave the default thresholds as is or change them to whatever you want.
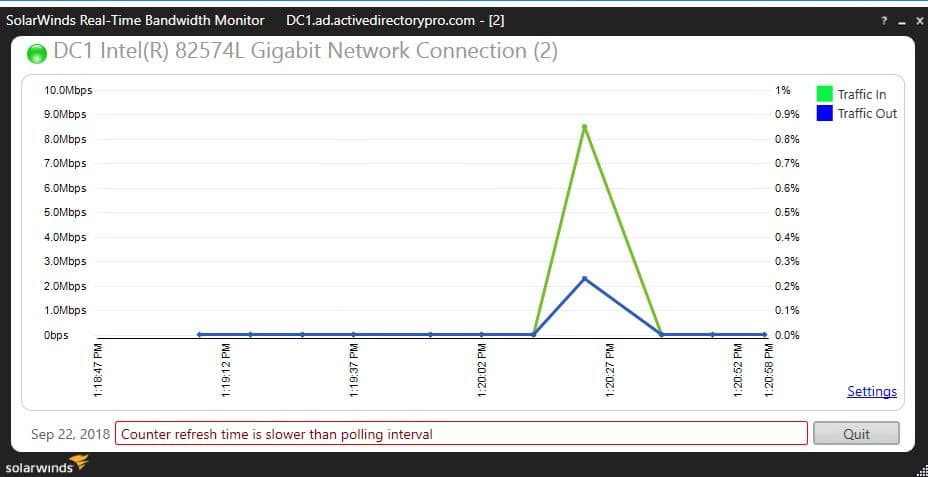
Now click Launch Monitor to start monitoring bandwidth in real time.
Below is a screenshot of the tool monitoring bandwidth in real time on my Windows server. This is a domain controller in my lab so there isn’t much network traffic.
If you want to monitor multiple servers or interfaces at the same time just walk through the wizard and add more devices.
If you want to monitor all servers at once and see historical data then take a look at SolarWinds NPM. This is an enterprise-level tool, I personally use this on client networks to monitor all servers and network devices.
Example 2: Monitor Server Application Traffic by Bandwidth
In this example, I’m going to use Wireshark to analyze network application traffic by bandwidth. Wireshark is a packet capture utility that lets you see what’s happening on the network.
This is a great tool to really understand what network traffic is going in and out of your servers.
If you want to monitor all servers and application traffic at once then move to example 3.
Step 1: Download & Install Wireshark
This is a free tool and you can download it here
You will need to install Wireshark on the server you want to monitor, there is no remote monitoring option.
Wireshark is easy to install, just select the defaults and choose to install WinPcap. You do not need to install the USBPcap option.
Step 2: Run Wireshark and select the Interface to Monitor
If you followed my tip from example 1 you should see your interface with the hostname. If not no big deal just select the interface you want to monitor.
In my case, the interface is named Ethernet. If your server has multiple interfaces they will all be listed on this screen.
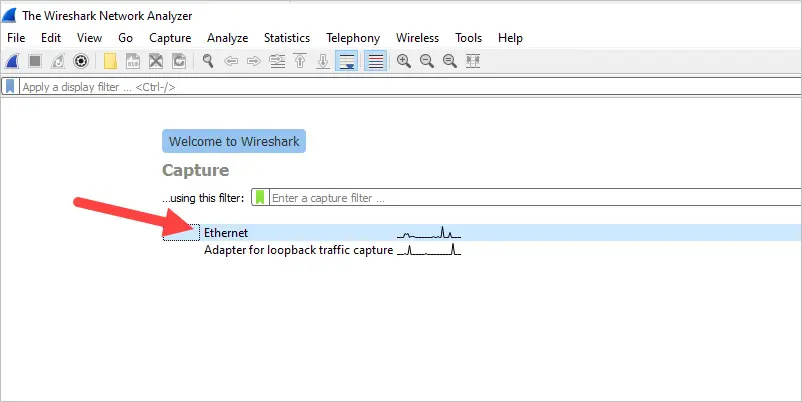
Once you select the interface Wireshark will start capturing packets.
You will see on the screen packets in real-time, let it run for a while to capture enough packets for analysis. If you are trying to troubleshoot a performance issue then run it at a time when you are experiencing the issue.
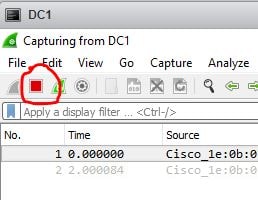
When you are ready to analyze the packets click the stop button
Step 3: Analyze the capture to identify Top Applications by Bandwidth
Now let’s analyze the capture and find the top applications by bandwidth.
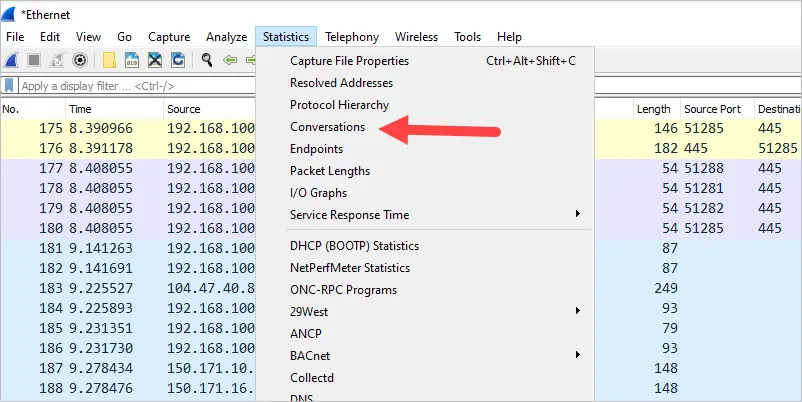
Click on Statistics then Conversations
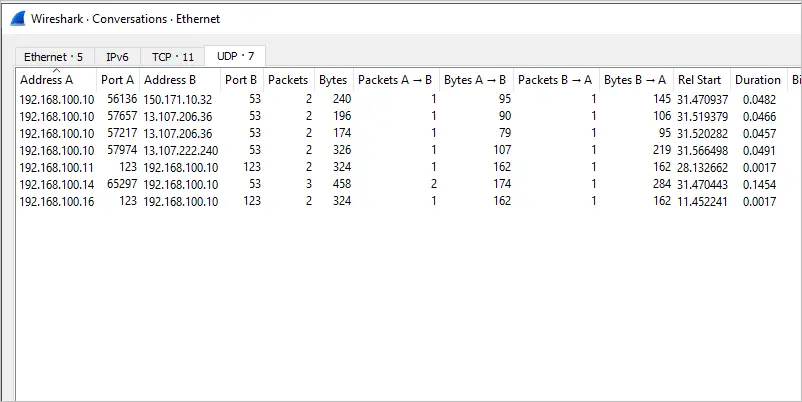
Click on the TCP tab, then click on the bytes tab and sort from highest to lowest. This will show you the top applications by bytes and tell display what client IP was using the bandwidth. I generated different types of traffic, take a look at the screenshot below and see if you can determine what type of applications are being used.
Have you figured it out?
All you need to do is look at column Port B to determine what applications are in use.
Column A is the source port and this is usually a random port, port B is the port the device is making a connection on. You can see most of the connections are connecting on port 445 and port 443.
Port 445 is SMB, so this tells me DC1 is being used as a file share.
Port 443 is https, so DC1 is making a secure http connection to various external sites. By doing a nslookup on the IPs I determined this was youtube traffic.
This method requires a little work and an understanding of TCP protocols. If you need to analyze the traffic on a single server to troubleshoot an issue this method works.
If you want a more automated method or to analyze all servers and traffic at once then check out the next example.
Example 3: Using iPerf to Measure Network Bandwidth Between Two Windows Hosts
iPerf is a simple lightweight tool that can be used to test network speed in terms of bandwidth. This tool is great for testing bandwidth between two hosts.
I’ve used this tool on several occasions to troubleshoot network speed issues between two Windows systems.
A client was having issues streaming and uploading from their office but it worked at another office using the exact same ISP and equipment. The ISP said they didn’t see any issues on their end (typical).
I used iPerf to measure the client to server bandwidth from both locations and showed them the huge speed difference. The ISP took another look and found they had an upload cap at the location. HA, no one takes the blame until you provide the data.
Now let’s take a look at how to use iPerf.
Step 1: Download and Install iPerf
You can download iPerf here https://iperf.fr/iperf-download.php
iPerf requires installation on two systems, one will act as the client and the other the server.
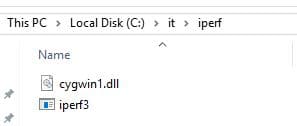
For Windows, unzip the download and place the files on two different systems.
I like to rename the folder and place it in a folder called “it”, do this on both systems.
c:\it\iperf
I have this setup on a server called DC1 and a Windows 10 computer called PC1.
Step 2: Test The Network Speed Between Two Windows hosts
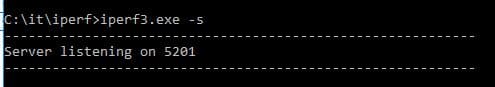
Before running a test you will need to make of the hosts the iperf server. On the host you want to act as the server open the command prompt, change to the iperf install directory, and run this command.
iperf3.exe -s
Now to start a test go to the client and run the command below, change ServerIP to the IP of the iperf server
iperf3.exe -c ServerIP
By default the test will run for 10 seconds you can change the time by using the -t option.
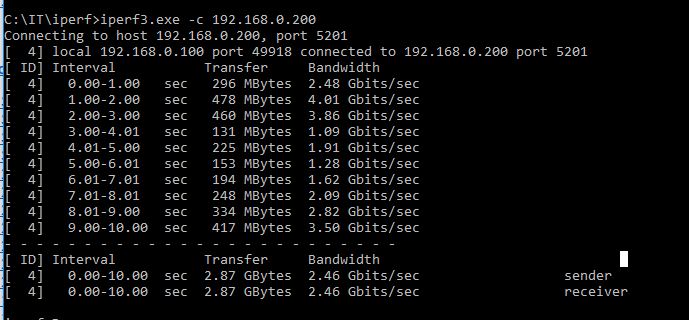
Now looking at the results you can see iperf was able to transfer 2.87 GBbytes of data averaging 2.46 Gbites/sec from client to server.
Easy right?
iPerf has several command line switches, you can see full documentation here https://iperf.fr/iperf-doc.php
An additional test I like to run is to change the direction of the test, this way I’m testing not only the download speeds but the upload as well.
You can either switch client to server or use the -R option to reverse the test.
Summary
So you now know how to monitor server bandwidth as well as measure the bandwidth between two hosts.
No joke I use every one of these tools, it just depends on the issue I’m troubleshooting.
Tools like Netfort LangGuardian I use to monitor all network and server bandwidth then for more specific issues I will use Wireshark or iPerf.
I recommend you download and try them all out.
good information
Thanks satyam